I turn operational data into models people can use. My path runs through aircraft maintenance, financial decisions, federal forecasting, and products I built from scratch.
Choose a chapter to see the problem, the method, and the result. The setting changes. The question stays: how can this work better?
Chapter 7 of 8
July 2011 – January 2014
Start where the work happens.
U.S. Air Force, Tinker AFB
Data Analyst / Maintenance Scheduler, GS-11
I built performance reports and improved the data behind maintenance scheduling. The first lesson: useful analysis starts with reliable operational records.
3,000+part numbers in a new labeling system
Supported 10+ process improvements across maintenance operations.
Operational reporting
Process improvement
Labor-hour analysis
Making the system visibleTechnical illustration
A consistent part label connects the physical item to its operational record.
January 2014 – April 2017
Put a number on the trade-off.
Self-employed, Tulsa
Real Estate Investor / Analyst
I evaluated acquisition, renovation, and resale decisions. Cost-benefit analysis became a practical tool for choosing properties, contractors, and project scope.
50+properties evaluated
Managed 15+ projects and reduced contractor costs by 20% through vendor selection and planning.
Cost-benefit analysis
Vendor comparison
Project planning
Underneath the purchase priceTechnical illustration
Acquisition cost, renovation scope, and resale assumptions define the decision.
April 2017 – March 2020
Think in probabilities.
HFLLC, Tulsa
Day Trader / Portfolio Analyst
I analyzed derivatives activity and built rule-based, time-series decision models. The work required explicit assumptions, disciplined risk analysis, and decisions under uncertainty.
$15M+derivatives activity in a calendar year
A foundation in probabilistic reasoning that later carried into forecasting and scenario analysis.
Time-series analysis
Risk analysis
Decision rules
One decision, many outcomesIllustrative distribution
Time-series signals inform a decision. They do not guarantee an outcome.
March 2020 – August 2020
Make the numbers reconcile.
Bank of Oklahoma, Tulsa
Security Services Operations Specialist I
I processed transactions and reconciled client funds. Accuracy, controls, and traceable reporting mattered at every handoff.
$30M+daily client funds processed and reconciled
Supported audit, compliance, and operations through reports and issue resolution.
Reconciliation
Data controls
Issue resolution
A traceable path through the dataProcess model
Transaction records enter a controlled process for accurate reconciliation.
August 2020 – August 2021
Find the constraint in the flow.
U.S. Air Force, Tinker AFB
B-52 Aircraft Maintenance Data Analyst, GS-11
I returned to aircraft sustainment with a broader analytical toolkit. I examined maintenance flow, workforce performance, and the causes behind production bottlenecks.
B-52maintenance operations and production analysis
Analyzed avionics, sheet metal, and electrics. Improved recurring reports with Excel macros.
Root cause analysis
Excel / VBA
Production metrics
A system of connected workAircraft schematic
Maintenance records connect shop activity, workforce capacity, and production flow.
August 2021 – August 2022
Turn recurring defects into a signal.
U.S. Air Force, 565th AMXS
B-52 Aircraft Lead Data / Management Analyst, GS-12
I designed a Functional Check Flight defect-tracking program. Connecting events across parts exposed recurring patterns and supported changes to maintenance flow.
700+Functional Check Flight events tracked
Identified recurring patterns in 10+ parts. Reduced post-dock flow by 5+ days, approximately 10%.
Also identified 35,000 production hours at risk from proposed policy changes.
Reliability signals
Capacity analysis
Leadership briefings
From events to a reliability signalProcess model
The tracking program connected 700+ check-flight events to recurring part failures.
August 2022 – present Current role
Forecast at federal scale.
U.S. Citizenship and Immigration Services
Operations Research Analyst, GS-14
I lead revenue and cost forecasting across 30+ revenue-generating forms. I build the data pipelines, scenario models, and reports behind executive decisions.
$7B+annual revenue and cost forecasting supported
Automated recurring reporting, saving approximately 24 workdays per year.
Python
SQL
Databricks / PySpark
SAS / Tableau
Explore a forecastIllustrative model
Move the slider to change an illustrative growth assumption. The curves show a scenario and uncertainty, not USCIS data.
March 2026 Education
Test the model. Question the score.
Eastern University
MS in Data Science, 4.0 GPA
My capstone joined 2024 flight records with historical weather and compared six regression models. I removed post-departure leakage and evaluated pre-departure signals only.
5.85Mflight records in the capstone pipeline
LightGBM test MAE: 21.7 minutes. Median absolute error: 12.6 minutes. R²: 0.077.
Python
LightGBM / XGBoost
scikit-learn
Streamlit
Compare the test resultsRecorded evaluation
Minutes of error · lower is better · bars start at zero
These are the corrected test results. Modest predictive performance is part of the result, not a number to hide.
Independent products
Models that became tools.
I also build products from the first data question to the interface people use. These are two examples you can explore today.
Live product preview
Document intelligence
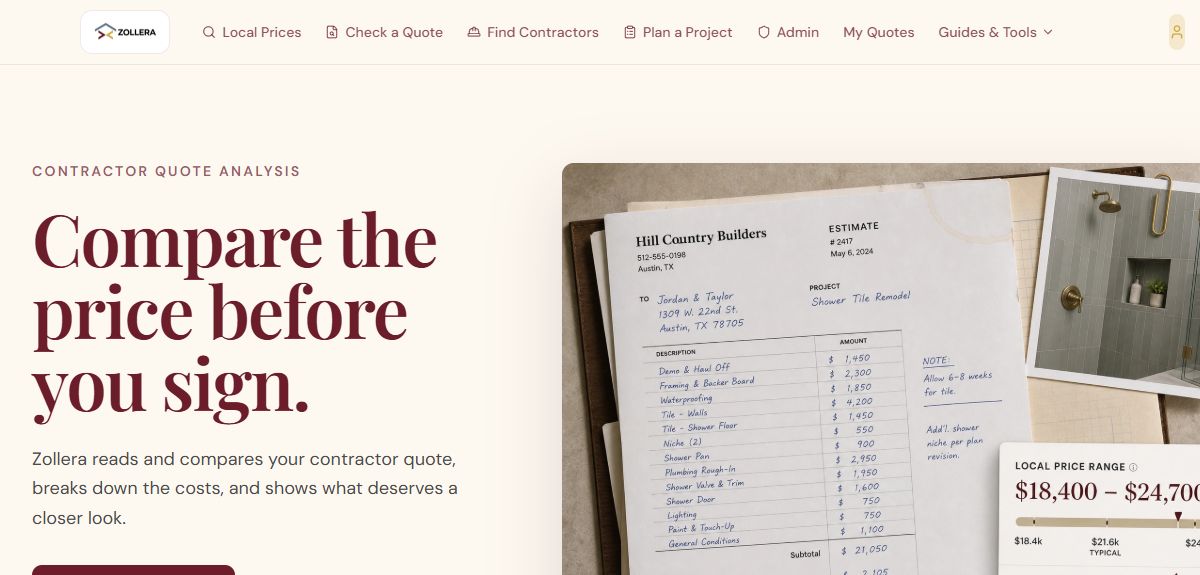
Zollera
A contractor quote, made easier to question.
I built a platform that turns PDFs, photos, and scans into comparable line items. A tiered LLM pipeline handles extraction and provider failover.
PII detection, redaction, normalization, and review controls surround the model so the output can support a useful decision.
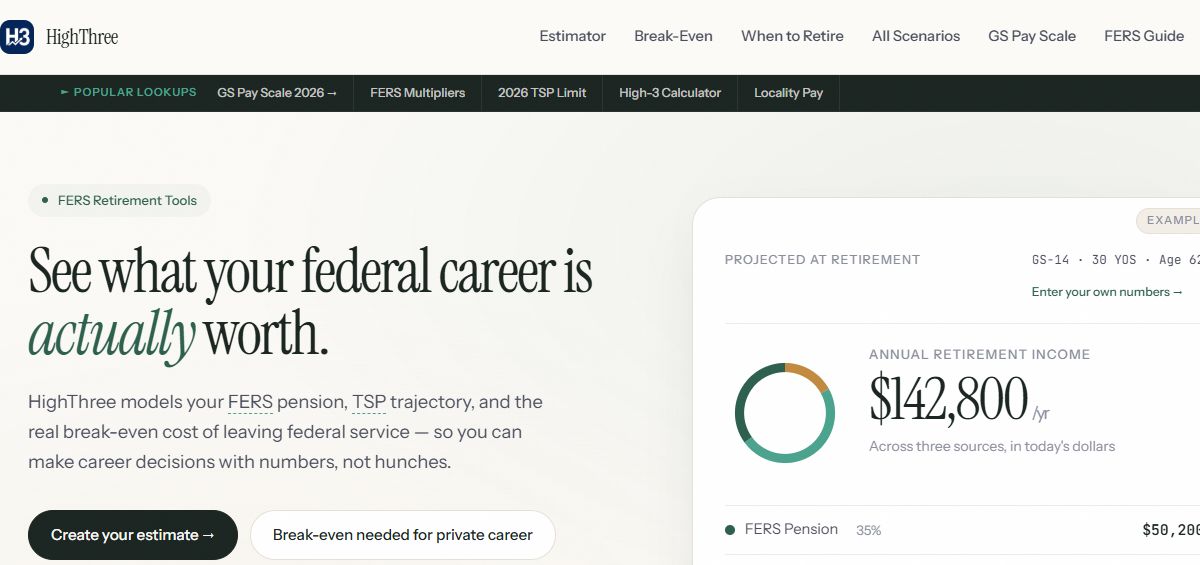
I built federal retirement tools that project salary, service, and pension income. Present-value models and scenario comparisons help users examine career decisions.
All calculations run in the browser. Salary and service inputs stay on the user’s device.
I’m most useful where the data is messy, the decision matters, and someone needs to own the path from raw records to a usable result.
I’m interested in senior data science, operations research, and analytics engineering roles focused on forecasting, simulation, or predictive maintenance.